Ideal quarterly investment letters: Meaningful, specific, and short
Investment managers’ quarterly investment letters should be meaningful to clients, specific to the manager, and short. These are the key conclusions I drew from my quarterly investment letter survey that I conducted some years ago. I believe these conclusions still apply.
Meaningful content
“Clarity,” “insight,” and “candor” were the most popular answers to the question, “What’s the ONE WORD that best describes what investment managers should strive for in their quarterly letters to clients?” I think these popular answers can be summed up by the term “meaningful content.”
The image below gives a visual overview of the responses. Type size is proportional to the number of respondents choosing a word as their answer.
Here are examples of how respondents explained their word choices.
- “Clarity” suggests that you have done the reading, research, analysis and due diligence on what you’ve taken in. You have synthesized it. Rather than repeating a litany of what you’ve read, you provide a simple summary of what key points you commend to their attention and why.
- Clarity. Clients appreciate honesty, and the best way to demonstrate honesty is to be clear in what you are saying. Always consider the client’s perspective. Put yourself in their shoes and ask yourself what is important / relevant, and how you would want it shown. And be honest with your answers.
- Candid. Warren Buffet discusses both types of investment – the ones that made money and ones where he lost – candidly.
- Clarity – The world and financial markets are very dynamic, intertwined, and complex. The ability of an investment manager to take seemingly disparate and complex topics and distill them down to an explainable relationship, etc is rare but very value-added.
- Needs to reflect the voice of the investment team not marketing fluff.
- Relevance – As a customer, it’s about my money, my future, my family, it’s not about your strategy, your brilliance, your research department. I need to know: Can I count on you?
Content specific to the manager
The survey asked respondents to specify whether various letter components were very important, important, somewhat important, unimportant, or not applicable. Respondents placed the highest importance on the manager’s investment strategy and review of the past quarter’s portfolio performance. Here’s the rank order:
- Manager’s investment strategy
- Review of the past quarter’s portfolio performance
- Manager’s market outlook
- Graphs, tables, or other illustrations
- Client-specific portfolio returns
- Stock-specific or security-specific comments
- Sector-level strategy
- Review of the past quarter’s market and economy
- Something not listed above
These results say to me that readers want content they couldn’t read elsewhere.
Here are some relevant responses:
- The investments are a commodity…the client bought the firm and that brand should be consistently presented in all interactions.
- What is missing in the vast majority of reports from managers is any genuine clue as to how and why they made/lost money. Market or asset class reviews or forecasts and returns summaries are ultimately meaningless if the manager doesn’t understand the drivers of his return. I like to see a thorough and genuinely insightful “attributions analysis” that makes it plain to the reader that the manager knows precisely why/how/where the money was made.
- Needs to be something more than what I get from Bloomberg or WSJ commentary. I want to understand their outlook, and how that shapes their strategy.
- Manager should include “what went right, what went wrong” during the quarter relative to investment performance. In other words, performance attribution at a high level.
Keep it short
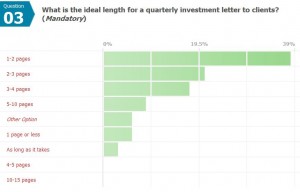
More than 40% of respondents thought a quarterly investment letter should run two pages or less. A length of five pages or more was the least popular response, as you can see in the graph below.
Respondents favor shorter letters that are reader-friendly, as the comments below show.
- Investors want you to tell them what THEY need to know, not everything YOU know!
- I read a lot of quarterly letters, and I selfishly would like to be able to pull out the important nugget(s) quickly. More importantly, as an investment advisor I know that my clients will not put a lot of time into reading these letters. If they look long and boring, they simply won’t bother.
- As an investment manager researcher, I read numerous quarterly commentaries from our sub advisors. The managers that are able to deliver the highlights clearly and in a concise manner stand out because they are better able to communicate their message to me and our clients.
- In my experience in investment communications, I’ve learned that less can be more. Get to the point quickly! Most financial advisors (and investors) don’t have much time to read and are in a state of information overload. Many receiving a 3-page commentary will put it in their “read later” pile (meaning it may never be read). However, if they received a shorter commentary (1-page would be ideal), they might read it upon receipt, getting information in a much more timely manner.
- People are busy and finance isn’t always the easiest or most scintillating topic; keep it short and sweet so you can keep your clients engaged and informed, Value their time.
- After three pages, most people get bored 🙂
Make it personal
It’s not easy to make quarterly letters feel personal and customized without spending lots of time on them. Some of the techniques that respondents suggested for achieving this included:
- Using “you”
- Integrating data from portfolio accounting
- Know the type of client that is attracted to your investment strategy and speak to that client’s biases and need for information.
- Answer the question, what is in it for them? Comfort them? Encourage them?
- Add a personal note within the body of the letter. “I took my son shopping for school supplies and Walmart…” and if there is an investment tie-in, so much the better.
- Include a personal touch regardless of how long it takes. These clients give us their hard earned money to manage and we should take time to report to them.
Well-written
A number of comments supported my belief that letters should be well written.
- I’m busy and I read a lot of investment letters, I don’t have time to reread investment letters in an effort to understand what the manager is really trying to tell me. I want a straightforward letter that I only have to read once to understand.
- You must write to the level of the average individual, not at a level that will impress your peers. Your clients would not be working with you if they did not believe you are intelligent…you don’t have to show them how intelligent you are by spewing out words that fly over their heads. If you want personalized and relevant letters, you must bring yourself to their level.
- I try to speak in my natural voice, rather than a “writing” voice. I also find that humor and self-deprecation (on non-professional issues) resonate with clients.
Thank you, CFA Institute LinkedIn Group members and other respondents!
I am very grateful to all of the people who responded. Your comments made this topic come alive. I wish I could have included more of them.
I believe most of the survey respondents are financial or marketing professionals, but I didn’t collect their demographics. However, I suspect that members of two of my LinkedIn Groups–CFA Institute Members and Financial Writing/Marketing Communications–were particularly generous with their contributions.
Note: This post originally appeared in 2021 and was edited on June 1, 2014, and June 18, 2024.









 Hire Susan to speak

